How do certain processes help you create value and meet customer requirements? Which activities add no value at all? Value-stream mapping can provide precise answers to these questions.
The aim of lean production in general and the continuous improvement process (CIP) in particular is to reduce throughput times. Doing so usually has a positive impact on productivity, since there is a close correlation between throughput times and productivity rates. However certain “opposing forces” can thwart attempts to achieve this aim. These are the 3Ms of lean production – so called because they all begin with the letter “M” – namely Muda (waste), Mura (imbalance) and Muri (overloading). Taking Muda – the best-known and impactful of the three – as an example, it is easy to highlight the kinds of things that get in the way of efforts to reduce throughput times. In the context of lean production, people always use the term Muda (waste) to refer to things that do not create value. Lean production focuses on seven types of waste (seven Muda) – these include activities such as overproduction and excessive movement of materials. However, how can you find out which activities in which process are not creating value in your own specific production operations? In lean production and lean management, this is precisely where value-stream mapping comes into play. This method is particularly used within the context of Six Sigma.
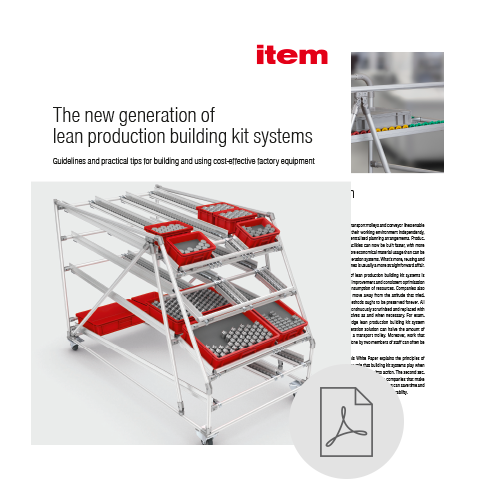
The world of lean production
Less waste and more added value – lean production methods help you make targeted improvements to your production efficiency. Our white paper provides a concise introduction.
DOWNLOAD NOW
Definition of value-stream mapping (VSM)
So what exactly is value-stream mapping? Let’s start with the value stream itself. This comprises all the processes that are needed to manufacture and supply a product. Value-stream mapping offers a way of analysing this value stream, providing a clear picture of the current state of the business processes. The various process steps are observed and timed, and the results are used to visualise material and information flows in a flow chart (see diagram further down). In general, value-stream mapping boasts certain characteristics and benefits:
- Mapping, drawing and creating material and information flows
- Reducing throughput times using a standardised, structured method for teams
- Having a basis for dialogue (rather than discussion) makes team work easier
- Providing a basis for optimising processes and helping avoid/reduce waste
Once value-stream mapping has been completed, the next stage is value-stream design. This involves developing the target state of processes and planning the relevant improvements. A post dedicated to value-stream design will appear on the item blog soon. If you would like to find out about both methods in more detail, you’ll find what you’re looking for in the item Academy – the free item training platform that offers a wide range of content, including well-constructed courses on these particular topics. All you need to gain direct access to the “value-stream mapping” and “value-stream design” online training units is an item user account.
Value-stream mapping – how to go about it
The first step in value-stream mapping involves forming product groups. A product group is a collection of products that undergo similar process steps. The products and associated production steps are therefore set out in a matrix (see diagram). Take a tour through the manufacturing plant, noting down all the production steps for each product and each version of every product. Versions that have manufacturing steps in common are gathered together in one product group.
If it isn’t possible to collect several products together into one product group, you end up with many product groups containing only one product. Then you need to carry out value-stream mapping for every single product.
Value-stream mapping then needs to be carried out separately for each and every product group. If it isn’t possible to collect several products together into one product group, you end up with many product groups containing only one product. Then you need to carry out value-stream mapping for every single product. The disadvantage of this is that the results are less meaningful and less transparent. The diagram below illustrates the formation of product groups based on three different products.

Calculating the customer takt time and visualising the value stream (with an example)
Once the product groups have been formed, the next step is to visualise the current situation in the form of a flow chart or value-stream diagram. This calls for precise knowledge of the customer’s requirements and is where calculation of the customer takt time comes into play. Customer takt time is the average (production) time after which the customer takes delivery of one more product. Later on, at the value-stream design stage, you can use this customer takt time to synchronise the production rate with the sales rate. This ensures your production is in line with customer requirements.
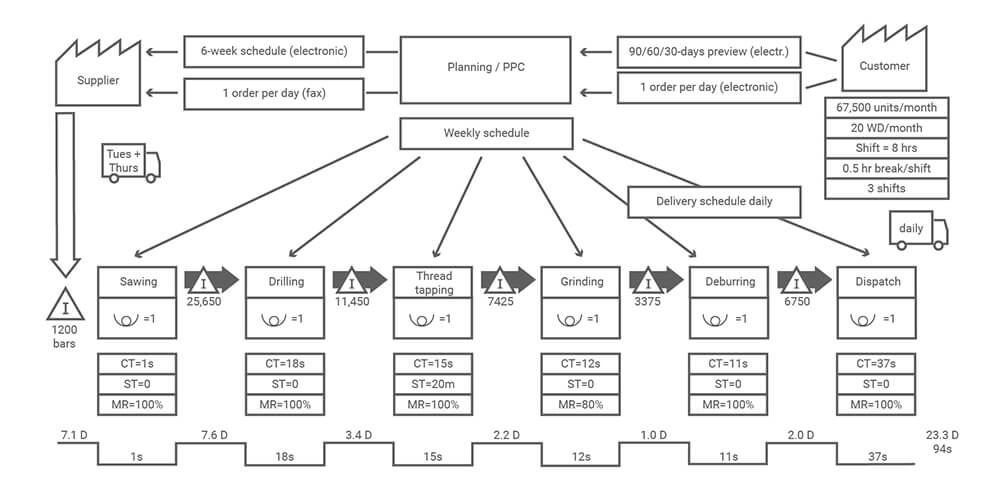
Once completed, the value-stream diagram clearly shows exactly where there is potential for improvement in the value stream – this might be in relation to throughput time or stock levels, for example.
In the actual value-stream diagram, special symbols are used for basic information, material flow and information flow. You can find out exactly what these symbols mean in the free courses available in the item Academy – including tasks to test your knowledge and clearly presented PDFs that you can print out and pass on to others. The structure of value-stream diagrams is always the same. The customer (top right-hand corner) is always the starting point. The mapping process then proceeds upstream through production and back to the supplier to depict the entire value stream. Once completed, the value-stream diagram shows exactly where there is potential for improvement in the value stream – this might be in relation to throughput time or stock levels, for example. You can also use the diagram to identify any scope for synchronising worksteps. Below is an example of what the value-stream mapping outcome or value-stream diagram might look like.
Making targeted improvements to processes – even more lean production know-how
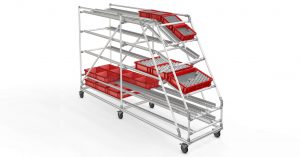
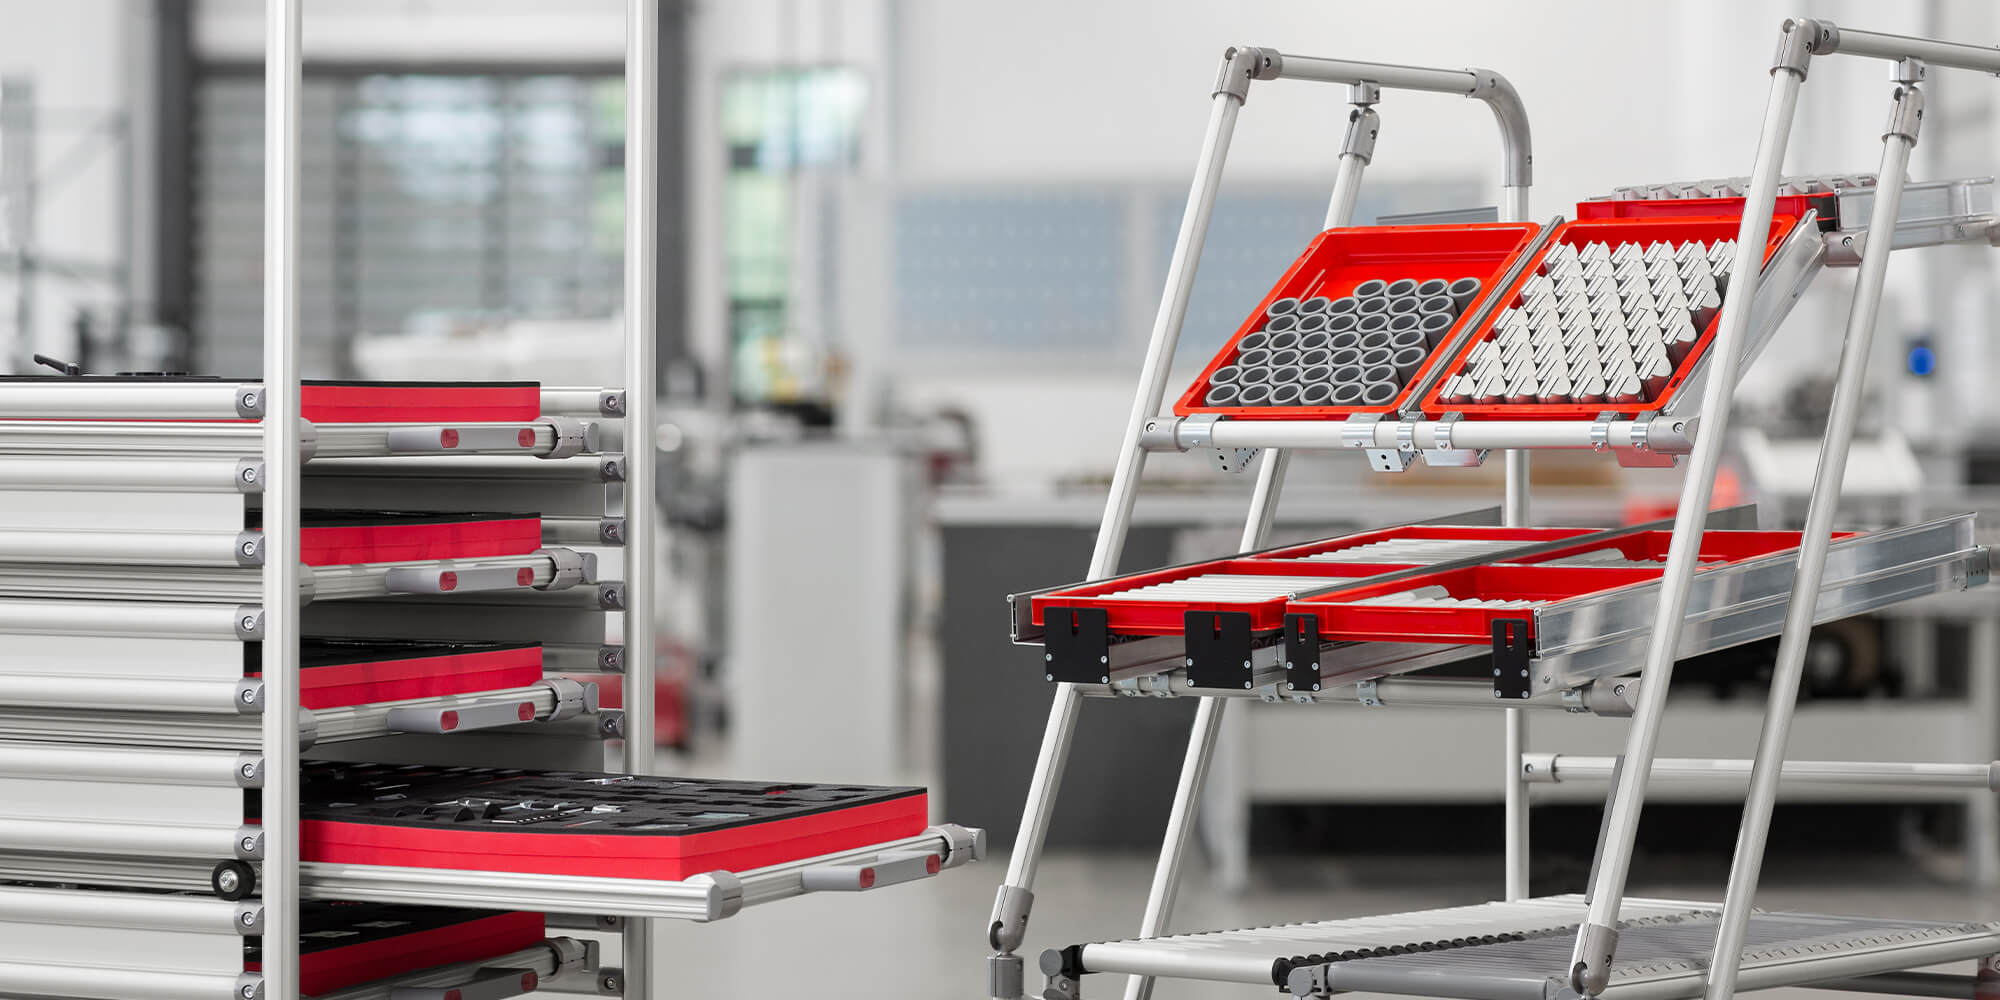
The different lean production methods complement one another and frequently overlap. Why not take value-stream mapping as an opportunity to dig deeper into this fascinating topic? item, which supplies the Lean Production Building Kit System and has continuously improved its own processes right from the outset, has focussed on lean production for many years now. We are more than happy to share this knowledge with our customers and anybody else who is interested. Over the years, we have built up an extensive archive of materials relating to lean production – from our guide and our posts on the item blog through to the training content available in the item Academy. We’ve put together a selection for you here.
In the item Academy (direct access with an item user account):
- Online training – Lean production basics
- Value-stream mapping
- Value-stream design
- Push and pull
- One-piece flow
- Assembly line design
- Visual management
- SMED
- Webinar: Rolling out lean production: Involving employees
- Webinar: The basics of lean production
On the item blog:
- Lean production – definition, explanation and benefits
- Rolling out lean production – how best to get staff on board
- Production management – a comparison of the push and pull principles
- The PDCA cycle – getting better bit by bit
- Process optimisation in production – an expert opinion
- The 7 Muda: Tackling waste
- One-piece flow – the direct way to lean production
- Visual management – 5S and Poka-Yoke
- Six Sigma: Quality management based on statistics
- Heijunka: Levelled production
Are you interested in fascinating reports and innovations from the world of lean production? Then we have just what you’re looking for! Simply subscribe to the item blog by completing the box at the top right.